BMI and Body Composition: Why the Scale Lies
Where BMI came from, when it works and when it fails, why waist-to-height ratio beats it, and how to read your body composition without expensive equipment.

Contents
Body mass index was invented in the 1830s to describe populations, not to assess individuals, and almost every complaint about it follows from that one fact. BMI cannot distinguish muscle from fat, is blind to where fat sits, and shifts meaning across ethnic groups. A tape measure around your waist tells you more — and the simplest useful rule in the whole field is that your waist should be less than half your height.
Where BMI actually came from
Adolphe Quetelet was a Belgian astronomer and mathematician, one of the founders of social statistics, and he was not thinking about health. In the 1830s he was building a description of l'homme moyen — the average man, a statistical abstraction around which the traits of a population distribute. He needed a way to express body weight independently of height so that groups could be compared.
He found that in adults, weight scales roughly with the square of height. Weight in kilograms divided by height in metres squared became the Quetelet index — a neat statistical trick, and nothing more. Quetelet studied no patients, tracked no diseases, and never proposed his index as a measure of an individual's health.
The modern name arrived in 1972, when physiologist Ancel Keys compared several weight-for-height indices and concluded that Quetelet's was the most suitable for epidemiological studies, renaming it the body mass index. The operative phrase is for epidemiological studies. Keys, too, was talking about populations.
What happened next was convenience winning. BMI needs two numbers that appear in every medical record and lets you compare countries and decades. Insurers, health systems, and clinical trials adopted it, and a statistical instrument quietly became a self-administered diagnosis delivered by an online calculator.
Where BMI earns its keep
Dismissing BMI entirely would be a mistake. In one domain nothing has replaced it.
Epidemiology. The association between BMI and type 2 diabetes, cardiovascular disease, several cancers, and all-cause mortality has been confirmed in cohorts of hundreds of thousands. WHO tracks global overweight and obesity by BMI precisely because it is the one measurement that can be collected identically in every country.
Population screening. If you need to know what share of a region carries elevated risk, BMI answers it. Errors in both directions cancel out at scale.
Change within one person. If your BMI went from 24 to 29 over five years and you have not been lifting weights, the added mass is almost certainly fat.
The extremes. Above 35 or below 17, the chance that BMI is misleading you is small. The contested zone is roughly 23 to 32 — which is, inconveniently, where most adults live.
Where BMI breaks
| Category | Standard WHO cut-offs, kg/m² | Lowered thresholds for South Asian, Chinese, other Asian, Middle Eastern, Black African or African-Caribbean background |
|---|---|---|
| Underweight | below 18.5 | below 18.5 |
| Healthy weight | 18.5–24.9 | 18.5–22.9 |
| Overweight | 25.0–29.9 | 23.0–27.4 |
| Obesity class 1 | 30.0–34.9 | 27.5–32.4 |
| Obesity class 2 | 35.0–39.9 | 32.5–37.4 |
| Obesity class 3 | 40.0 and above | 37.5 and above |
Muscle
Muscle tissue is roughly 15–20 percent denser than fat. A rugby player at 180 cm and 100 kg with 12 percent body fat lands at a BMI of 30.9 — formally class 1 obesity, with no elevated risk whatsoever.
This is not only about elite athletes. Someone who has trained seriously with weights for two or three years can move up a category while their health improves in every measurable way. That is exactly why NICE explicitly notes that waist-to-height ratio can be used in adults with high muscle mass, for whom BMI misleads.
Читайте также: Strength Training for Beginners: How to Start
Age and muscle loss
The opposite error is more common and costs more. Adults lose roughly 3 to 8 percent of muscle mass per decade after thirty without resistance training, and the rate accelerates after sixty. Weight often stays flat while it happens: muscle leaves, fat arrives, the number holds.
The result is that a woman of 70 with a BMI of 23 may carry a higher body fat percentage than she did at 30 with a BMI of 27. On paper she is fine. In practice she has less muscle, a weaker grip, a higher risk of falls and fractures, and worse insulin sensitivity. BMI registers none of it.
There is a further wrinkle: past 65, a BMI of 25 to 27 is associated with lower rather than higher mortality, because a modest reserve of mass becomes an asset during illness. Thresholds that make sense at 35 do not transfer to 75.
Ethnicity
This is the most practically important and least widely known limitation of BMI.
A WHO expert consultation published in the Lancet in 2004 reviewed data from Asian populations and found a consistent offset: at any given BMI, people of South and East Asian descent carry a higher proportion of body fat, and notably more visceral fat, than European populations. Type 2 diabetes and hypertension appear at BMI values that standard tables call healthy or barely elevated — from around 23 upward.
The consultation stopped short of creating a separate international classification but recommended additional public health action points at 23, 27.5, 32.5 and 37.5. NICE went further in 2025 with a practical rule: for people of South Asian, Chinese, other Asian, Middle Eastern, Black African or African-Caribbean family background, lower the BMI thresholds by 2.5 kg/m². Overweight starts at 23, obesity at 27.5.
If that describes your background, every generic online BMI calculator is systematically reassuring you. Worth knowing.
Your waist tells you more
Total weight reports how much mass you carry. Waist circumference reports where it sits — and for metabolic risk, location matters more than quantity.
Following its 2008 expert consultation, WHO uses these waist thresholds for European populations:
| Measure | Men | Women | Interpretation |
|---|---|---|---|
| Waist circumference, increased risk | 94 cm or more | 80 cm or more | Worth paying attention to |
| Waist circumference, substantially increased risk | 102 cm or more | 88 cm or more | Worth raising with a clinician |
| Waist-to-height ratio | below 0.5 | below 0.5 | Healthy central adiposity |
| Waist-to-height ratio | 0.5–0.59 | 0.5–0.59 | Increased central adiposity |
| Waist-to-height ratio | 0.6 or more | 0.6 or more | High central adiposity |
Waist-to-height ratio fixes the obvious flaw in raw centimetres: an 85 cm waist means something very different at 155 cm tall than at 185 cm. The systematic review and meta-analysis by Ashwell and colleagues (Obes Rev, 2012) compared the three screening tools directly and found waist-to-height ratio outperformed both waist circumference and BMI for detecting cardiometabolic risk factors.
The phrasing NICE recommends for conversations with patients could not be simpler: keep your waist to less than half your height. No calculator, no table, no chart — a tape measure and one division.
Visceral versus subcutaneous fat
Fat tissue is not one substance with one job. Subcutaneous fat lies between skin and muscle and can be pinched between your fingers. Visceral fat sits inside the abdominal cavity, packed around the liver, pancreas, and intestines, and cannot be pinched at all — the abdomen feels firm rather than soft.
The difference is biochemical, not cosmetic. Visceral fat is metabolically busier: it releases more free fatty acids and more pro-inflammatory signalling molecules, and its venous drainage runs through the portal vein straight into the liver. From there the chain is familiar — insulin resistance, disordered blood lipids, chronic low-grade inflammation, fatty liver disease.
Subcutaneous fat on the hips and thighs is close to metabolically neutral, and some evidence suggests it is mildly protective, acting as a safe storage depot. That is the substance behind the old "apple and pear" observation: at identical weight, abdominal distribution carries the higher risk.
The encouraging part is that visceral fat responds first. Even a modest 5 to 7 percent reduction in body weight shrinks the visceral compartment disproportionately, which is why the waistband often loosens before the scale gives you anything to celebrate.
Читайте также: Visceral Fat: Why It's Dangerous and What Actually Removes It
Читайте также: Calorie Deficit: How to Calculate It and Actually Stick to It
Measuring body composition
Bioimpedance
The accessible option: smart scales at home, handheld devices at the gym, clinic machines. A weak alternating current passes through the body, tissue resistance is measured, and an equation converts that resistance into fat and lean percentages.
The equation is the weak link. The device does not measure fat; it measures electrical resistance, and resistance depends first and foremost on body water. Dehydration after a workout, a salty dinner, cycle phase, a full bladder, a coffee — each moves the reading. Typical error for fat mass is 3 to 5 percentage points, and consumer scales with foot electrodes only read the lower half of the body and model the rest.
The conclusion is not to throw the scale away but to use it correctly: measure under identical conditions every time and read the trend across months rather than any single output.
DEXA
Dual-energy X-ray absorptiometry is the practical research standard. It separates fat, lean, and bone mass, reports regional distribution, and estimates visceral fat, with errors on the order of 1 to 2 percent. The drawbacks are cost, availability, and a small radiation dose — it is not a weekly progress tool.
Skinfold calipers
Pinching skinfolds at three to seven sites is cheap and, in trained hands, reproducible. But the result depends heavily on the operator's skill, and visceral fat is invisible to the method by definition.
What is actually available to you
| Method | Accuracy | Availability | Best used for |
|---|---|---|---|
| Tape measure (waist, waist-to-height) | Highly reproducible | Free, at home | Your primary everyday tool |
| Bathroom scale | Exact for mass, blind to composition | At home | Weekly averages, multi-week trends |
| Bioimpedance | 3–5 point error, hydration-dependent | Home and gym | Trend under identical conditions |
| Skinfold calipers | Operator-dependent | Needs a trained tester | Subcutaneous fat, athletic monitoring |
| DEXA | 1–2% | Paid, by appointment | A reference point once or twice a year |
| Photos and how clothes fit | Subjective but honest | Free | What the instruments miss |
Normal weight obesity
There is a state that no weight-based screen detects: a BMI inside the healthy range paired with a high fat percentage and very little muscle. The literature calls it normal weight obesity.
The typical picture is a desk job, no resistance training, a history of repeated dieting that shed muscle along with fat, and a weight that has looked reassuringly stable for years. Depending on the population and the body fat cut-off applied, studies find this pattern in a substantial share of people with a "normal" BMI — in some samples one in five or more.
Metabolically, these people sit closer to the overweight group than to peers with the same BMI and a healthier composition: greater insulin resistance, worse lipid profiles, higher inflammatory markers. And no screening programme built on weight will ever flag them, because their weight is fine.
The practical implication is not a diet. At a healthy weight, the lever that matters is building lean mass, not losing kilograms: resistance training and enough protein, not a calorie deficit.
Читайте также: Metabolism Myths: What Actually Speeds It Up
Читайте также: Ideal Weight Calculator: Your Healthy Range by Height
Читайте также: BMI Calculator: Work Out Your Body Mass Index Online
Where clinical practice is heading
In 2025 a Lancet Diabetes & Endocrinology Commission chaired by Francesco Rubino proposed fixing the problem at the level of definitions. Rather than treating obesity as a diagnosis conferred by a single BMI value, the Commission splits it in two.
Preclinical obesity — excess adiposity with organ function and daily activities intact. A state of increased risk, not a disease.
Clinical obesity — excess adiposity that is already impairing organ function or limiting day-to-day activities. A disease requiring treatment.
The Commission also recommends that obesity should not be diagnosed on BMI alone: it should be confirmed by at least one additional measure of fat distribution — waist circumference, waist-to-height ratio, or waist-to-hip ratio — or by direct measurement of body fat. The one exception is BMI above 40, where excess adiposity can reasonably be assumed.
The logic is worth restating plainly: a diagnosis should depend on how a person's body is functioning, not on where they land on a scale.
What to watch instead of one number
A reasonable dashboard looks like this, and none of it requires equipment you do not already own:
- Waist-to-height ratio. Every two to four weeks, measured the same way. Target: below 0.5.
- Weight trend, not weight. Compare this week's average against last week's. A single morning reading means almost nothing — glycogen, sodium, cycle phase, and gut contents swing it by 1–2 kg routinely.
- Strength. Are your working weights climbing? How many push-ups or pull-ups can you do? This is a direct read on muscle and function.
- Endurance and how you feel. Breathlessness on the fourth flight of stairs, recovery after exertion, energy through the afternoon.
- Blood markers. Fasting glucose, HbA1c, lipid panel, blood pressure. These describe the outcomes that the entire weight conversation is supposedly about.
- How clothes fit, and photographs. Every month or two under the same conditions. When composition changes at stable weight, the instruments go quiet and the jeans do not.
Trend beats absolute value for a straightforward reason: every one of these measures carries its own error and its own individual baseline, but change within one person measured the same way is always meaningful.
Your weight is not a measure of your worth
It is worth saying directly what most articles about weight leave out.
Body mass index is a ratio between two numbers, devised by a 19th-century statistician to describe the average Belgian. Waist circumference is centimetres. Body fat percentage is an estimate produced by an equation with several points of error. Not one of these describes how healthy, disciplined, attractive, or valuable a person is. They describe probabilities across large groups.
A medical conversation about weight is useful exactly to the extent that it stays attached to concrete things: blood pressure, blood sugar, joint mobility, sleep, how you feel climbing stairs. The moment it becomes a conversation about the number for its own sake, it stops being about health — and, judging by what is known about weight stigma and eating behaviour, starts getting in the way.
If you take one action from this article, make it this: find a tape measure, measure your waist, divide by your height. One number that tells you more about your health than the scale does, and asks for no daily ritual and no anxiety in return.
FAQ
Is BMI accurate for an individual?+
Not really. BMI was designed to describe populations, not to diagnose people. It predicts risk well across large groups, but for one person it cannot tell muscle from fat and says nothing about where that fat sits. As a standalone verdict on your health, it fails.
Are BMI thresholds different for Asian populations?+
Yes. A 2004 WHO expert consultation found that in South and East Asian populations, diabetes and cardiovascular risk rise from a BMI of about 23, well inside the standard healthy range. NICE guideline NG246 (2025) recommends lowering the thresholds by 2.5 kg/m² for people of South Asian, Chinese, other Asian, Middle Eastern, Black African or African-Caribbean family background.
What waist-to-height ratio should I aim for?+
Under 0.5 — your waist should measure less than half your height. NICE classifies 0.4 to 0.49 as healthy central adiposity, 0.5 to 0.59 as increased, and 0.6 or more as high. The rule applies to both sexes and across ethnic groups.
How accurate are smart scales that measure body fat?+
They do not measure fat. They measure how tissue resists a small electrical current and convert that into percentages using equations. Typical error for fat mass is 3 to 5 percentage points, and readings shift with hydration, time of day, and what you ate yesterday. Ignore the absolute number; track the trend under identical conditions.
What is normal weight obesity?+
A BMI in the healthy range combined with a high body fat percentage and little muscle. These people pass every weight-based screen while carrying metabolic risk closer to that of people with overweight — higher insulin resistance, worse lipids, more inflammation.
Should I weigh myself at all if the scale lies?+
Weigh yourself if it helps, treating the number as one input among several and watching the weekly trend rather than any single morning. If stepping on the scale drives anxiety, colours your mood, or triggers restriction, the sensible move is to stop and talk to a clinician.
References
- 1.WHO. Obesity and overweight — fact sheet
- 2.WHO Expert Consultation. Appropriate body-mass index for Asian populations and its implications for policy and intervention strategies. Lancet, 2004
- 3.WHO. Waist circumference and waist-hip ratio: report of a WHO expert consultation, Geneva, 2008
- 4.Ashwell M et al. Waist-to-height ratio is a better screening tool than waist circumference and BMI for adult cardiometabolic risk factors: systematic review and meta-analysis. Obes Rev, 2012
- 5.NICE. Overweight and obesity management. NICE guideline NG246, 2025
- 6.Rubino F et al. Definition and diagnostic criteria of clinical obesity. Lancet Diabetes Endocrinol, 2025
Read next
Cheat Meals and Refeeds: Do They Really Boost Your Metabolism?
How a cheat meal differs from a refeed and a diet break, whether they really 'boost metabolism' via leptin, and what actually helps you get through a long diet.
Safe Weight Loss Rate: How Many Kg a Week Is Normal
What rate of weight loss counts as safe, why faster is not better, how to preserve muscle while losing fat, and when a slowdown on the scale is normal.
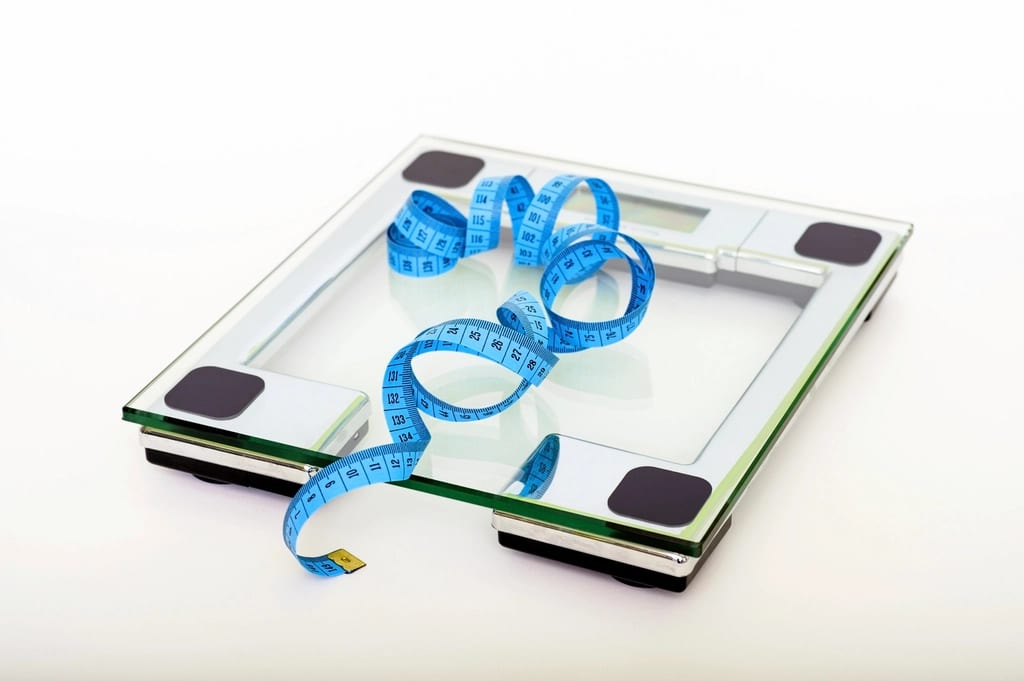
Visceral Fat: Why It Is Dangerous and What Actually Removes It
How visceral fat differs from subcutaneous fat, why it carries more risk, how to assess it without an MRI, and which changes to diet and training genuinely shrink your waist.
GLP-1 Weight Loss Drugs: How They Work, Results and Risks
Semaglutide and tirzepatide explained: mechanism, real weight loss numbers from the STEP and SURMOUNT trials, side effects, muscle loss, weight regain after stopping, and who they are for.

Weight Loss Plateau: Why the Scale Stops and What to Do
Why weight loss stalls: water retention, metabolic adaptation, falling NEAT and portion creep. Real numbers on adaptation, plus a fix-it order that works.

Metabolism Myths: What Actually Speeds It Up
What your daily energy burn is really made of, why metabolism does not crash at 30, and which levers — muscle, NEAT, protein, sleep — actually move the number.